U.S. Composite Historical and Forecast Degree Day Data
Additional New Degree Day Data Sets
This degree day data set is calculated in the same manner that NOAA and some other vendors calculate their HDDs and CDDs but the resulting output data may not be identical.
|
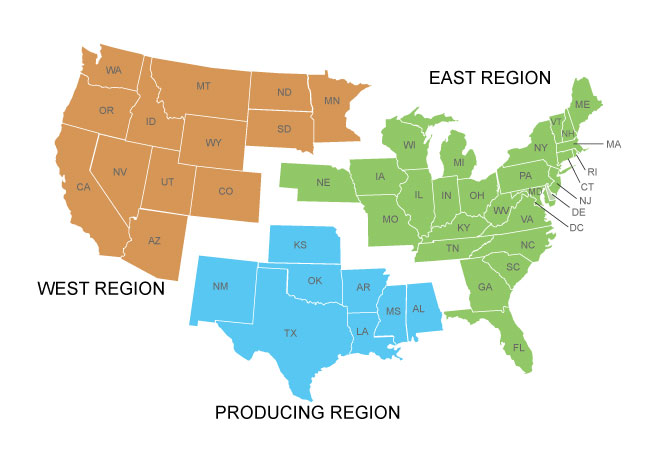
Regional = EIA and Census Regions |
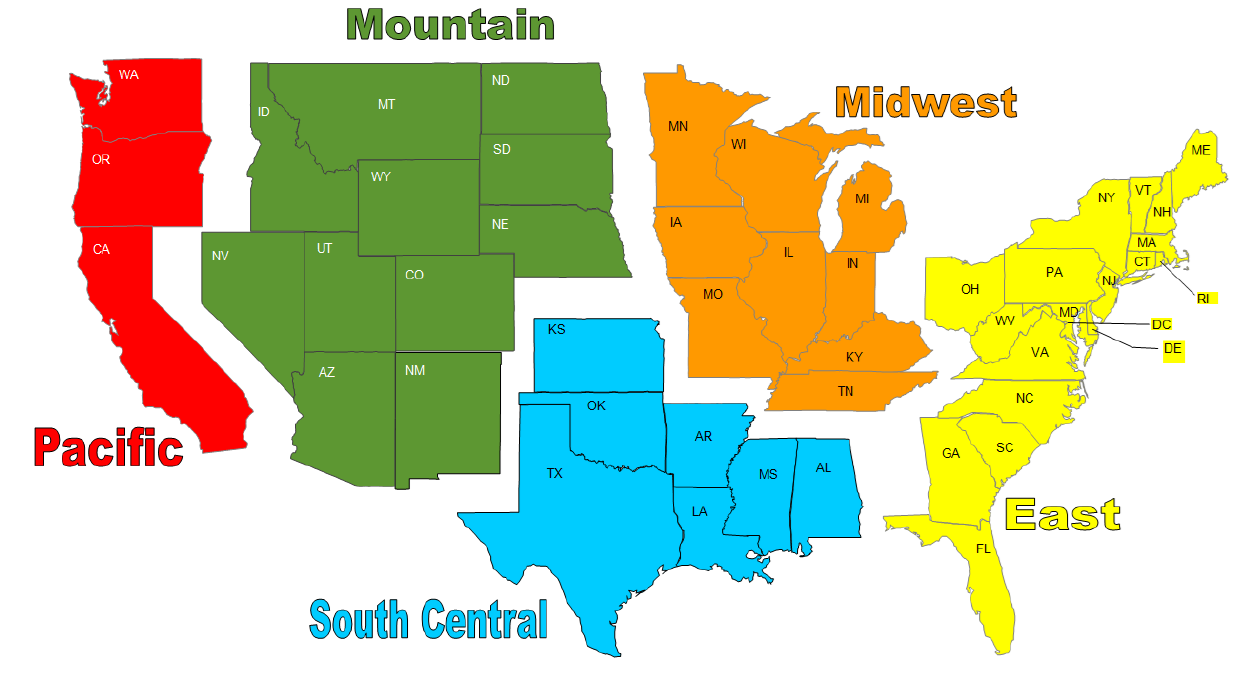
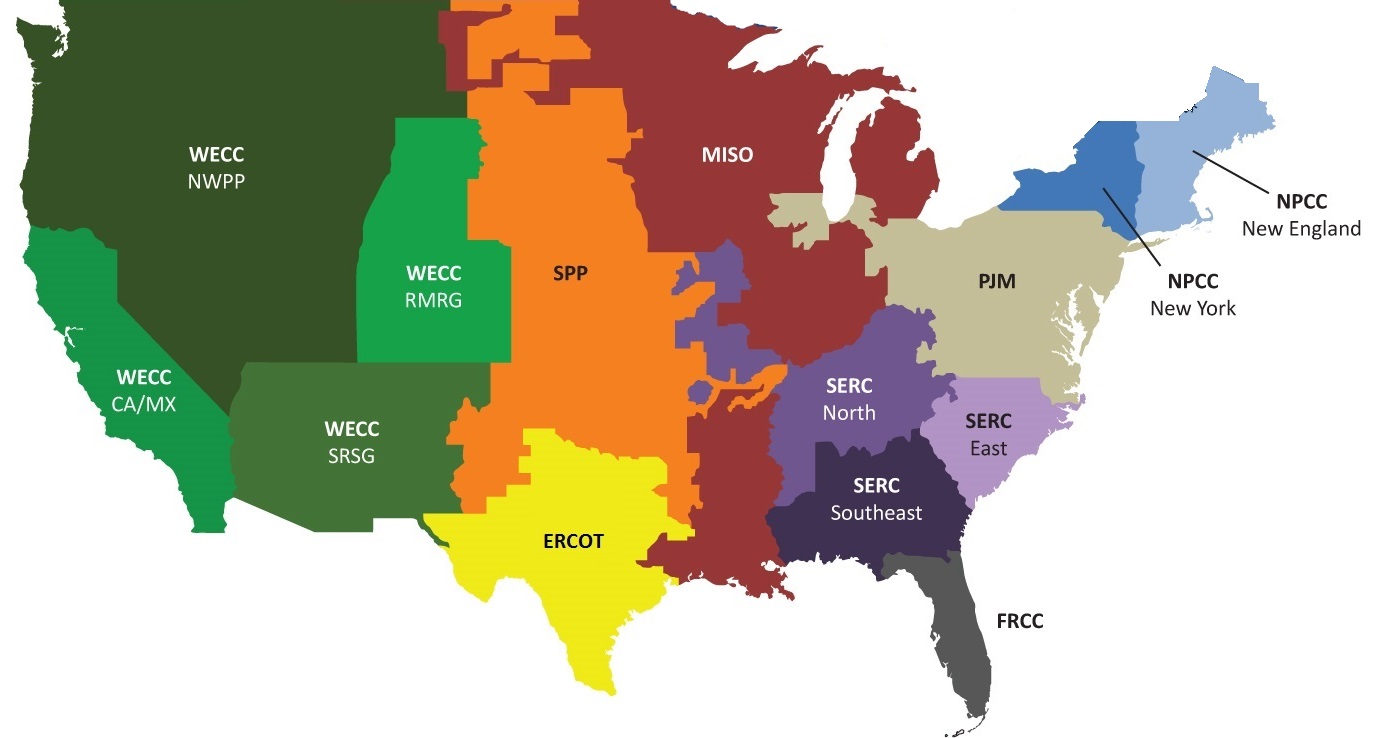
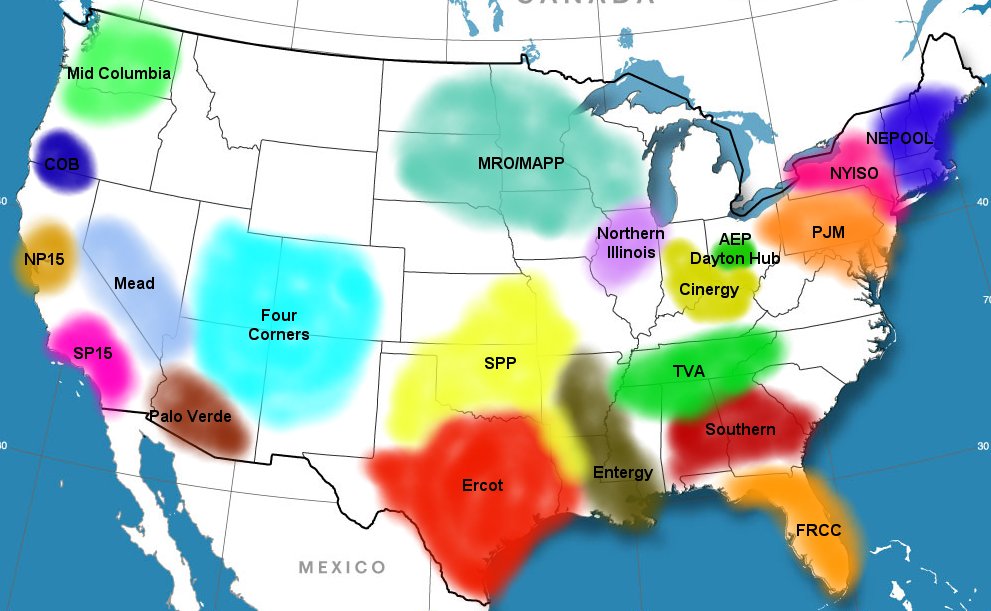
Map of Power Regions |
|||
|
|
|
|
|
|
|
|
Last 10 Years - Forecast Last Year - Forecast 1981-2010 Averages |
Last 10 Years - Forecast Last Year - Forecast 1981-2010 Averages |
Last 10 Years - Forecast Last Year - Forecast 1981-2010 Averages |
Last 10 Years - Forecast Last Year - Forecast 1981-2010 Averages |
|
|
1981 - Forecast |
1981 - Forecast |
1981 - Forecast |
1981 - Forecast |
|
|
1981-2010 Averages |
1981-2010 Averages |
1981-2010 Averages |
1981-2010 Averages |
Population Weighted Weather Data
The above data sets use 230 observation sites to calculate the various population weighted data sets versus only 121 observation sites in the old data sets.
PWvbY = Population weights vary by yearly population data
PWf2010 = Population weights fixed for all years to 2010 populations
Guide to Population and Gas Weighted Degree Days
Combined U.S. Degree Day Files
The data files combine the US gas weighted HDDs (R&C), the NG/AC weighted CDDs, the population weighted HDDs and CDDs, the electric heating weighted HDDs, and the fuel oil and propane weighted HDDs into one file. All data is based on the data files that have the weightings fixed to 2010 values (the PWf2010 versions) and also include the previous years values (relative to the year a given data value is from) along with the current 10 and 30 year averages. The 10 and 30 year averages in the entire file are valid as of this year. They are not a rolling 10 and 30 year average.
These data files update between 7:15 and 7:30 AM CT, and again at midday.
| U.S. Degree Days Combo File from 1982 through the next 8 months | U.S. Degree Days Combo File for the Last 15 days and Next 15 Days |
| U.S. Degree Days Combo File 2 from 1982 - Forecast (additional data) | U.S. Degree Days Combo File 2 for Last 15 - Next 15 (additional data) |
Natural Gas, Electric, Fuel Oil and Propane Heating Weighted HDDs and NG/AC Weighted CDDs
The data sets use 230 observation sites to calculate the various weighted data sets versus only 121 observation sites in the old data sets. Additionally, weighting techniques have been revised and data is now available for NG heating, electric heating, and combined NG plus electric heating where the electric heating component is weighted based on the percent of power production from NG in each power region of the country. Propane heating weighted data is also now available in addition to heating (fuel) oil weighted data. A new gas weighted CDD data set is also now available that combines the percent of homes with air conditioning with the percent of power production from natural gas in each power region.
PWvbY = Weights vary by year as a result of population and heating fuel changes
PWf2010 = Weights fixed to 2010 values
Guide to Population and Gas Weighted Degree Days
| Date Range | U.S. and EIA 3 Region HDD Data | U.S. and EIA 5 Region HDD Data | U.S. Fuel Oil & Propane Weighted HDDs | PADD Region Fuel Oil, Propane, Population Weighted HDDs | U.S. and EIA 3 Region CDD Data | U.S. and EIA 5 Region CDD Data |
| 1980
through 2013 |
PWvbY | PWf2010 | PWvbY | PWf2010 | PWvbY | PWf2010 | PWvbY | PWf2010 | PWvbY | PWf2010 | PWvbY | PWf2010 |
| 2014
through 9 Month Forecast |
PWvbY | PWf2010 | PWvbY | PWf2010 | PWvbY | PWf2010 | PWvbY | PWf2010 | PWvbY | PWf2010 | PWvbY | PWf2010 |
| 1996
through 9 Month Forecast |
PWvbY | PWf2010 | PWvbY | PWf2010 | PWvbY | PWf2010 | PWvbY | PWf2010 | PWvbY | PWf2010 | PWvbY | PWf2010 |
| Monthly
Averages/Totals |
PWvbY | PWf2010 | PWvbY | PWf2010 | PWvbY | PWf2010 | PWvbY | PWf2010 | PWvbY | PWf2010 | PWvbY | PWf2010 |
Old Formats of Population and Gas Weighted Data
| Population Weighted | Natural Gas Heating Weighted | Oil Heating Weighted | ||||||||||||||||||||
|
|
|
||||||||||||||||||||
| NOAA Data Files | ||||||||||||||||||||||
|
Weekly Data
• CDD Pop Weighted • HDD Pop Weighted
Monthly Data
Archived Data
|
||||||||||||||||||||||