Wind Generation Forecasts
The natural gas demand offset is estimated by calculating the amount of natural gas needed to produce the amount of electricity generated from wind farms each week. Two values are given, a maximum value that assumes 100% of the wind generation offsets natural gas demand, and another that assumes about 40% of the wind generation offsets natural gas demand. The 40% figure was derived from a regression analysis. The amount of natural gas demand offset by wind generation will generally be higher during the cooling season and lower during the heating season.
The above plot of storage number contribution attempts to show the potential influence variations in wind generation will have on the weekly NG storage numbers. Since average wind generation is generally indirectly factored into NG storage models, this plot, as well as the storage number contribution values in the available data files, show the difference between the 12 month average natural gas demand offset and the actual demand offset for each week. So, a negative value (less wind generation) implies the weekly storage number might be lower than expected since more power generation will be needed from other sources, and a positive value (more wind generation) implies the storage number might be higher than otherwise expected.
Click a region in the legend to turn that region on or off
US Hourly Forecast File for All Regions
US Hourly Observed Since 2014 Plus Forecast*
Estimated Historical Hourly Generation by State**
US Hourly "Observed" Gen Last 7 Days
US Hourly "Observed" Gen Full Archive
US Hourly Forecasts Alt Format 1 (CPT)
US Hourly Forecasts Alt Format 2 (CPT)
US Hourly Forecasts Alt Format 3 (UTC)
US Hourly Forecasts Alt Format 4 (UTC)
US Daily Avg Wind Gen Last 7/Next 7 Days
US Daily Average Wind Gen Full Archive
US Hourly Observed Since Day-14 Plus Forecast*
US Daily Observed Since 2014 Plus Forecast*
US Daily Observed Since Day-14 Plus Forecast*
Estimated Historical Daily Total Generation by State**
Estimate Historical Daily Average Generation by State**
Forecast Hourly Generation by State
CA Hourly Forecast File for All Regions
CA Hourly "Observed" Gen Last 7 Days
CA Hourly "Observed" Gen Full Archive
CA Hourly Forecasts Alt Format 1 (CPT)
CA Hourly Forecasts Alt Format 2 (CPT)
CA Hourly Forecasts Alt Format 3 (UTC)
CA Hourly Forecasts Alt Format 4 (UTC)
CA Daily Avg Wind Gen Last 7/Next 7 Days
CA Daily Avg Wind Gen Full Archive
-
-
-
-
* These data files contain actual reported wind generation data for some regions, including ERCOT, MISO, SPP, PJM, CAISO (for all Cal) and BPA (for NWPP).
** These data files contain estimated historical and forecast wind generation totals by state that are interpolated from the ISO regions. These data files will continue to evolve as we work on refining our estimation routines.
Click here to view an Excel file with wind farm site locations and information.
Below is a listing of the various data file types that are linked to on this page and available by ftp, along with notes on each data file.
latest_all_all_sites.csv
contains forecasts for all wind individual wind farms (at least should), if you notice a farm missing, let us know.
latest_all_sites_all_regions.csv
contains a subset of forecasts for multiple farms in multiple regions concatenated together into one file.
The files of the format:
latest_all_SPP_AA_sites.csv
contains the forecasts for all wind farms in the SPP region, concatenated together. Note that some new wind farms may not be included. We update our wind generation forecast periodically during the year as new farms come online, but it may be weeks or months before we have a new farm in the forecast system. If there is a wind farm currently operational that we do not have in the system that you are interested in, please let us know and we can prioritize that farm.
latest_all_SPP_sites.csv
contains the forecasts for a subset of wind farms in the SPP region, concatenated together
The files of the format:
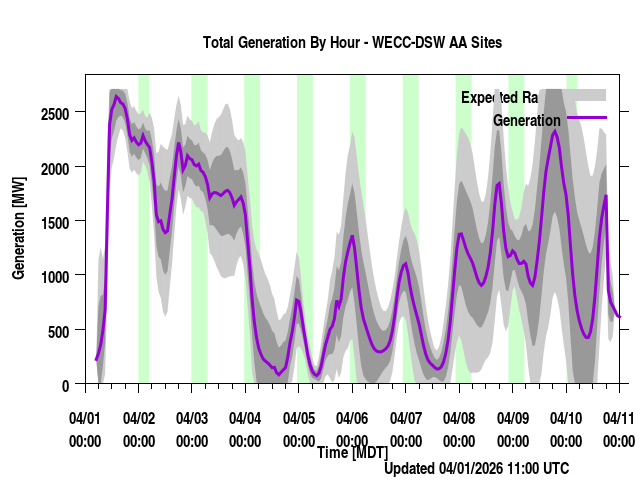
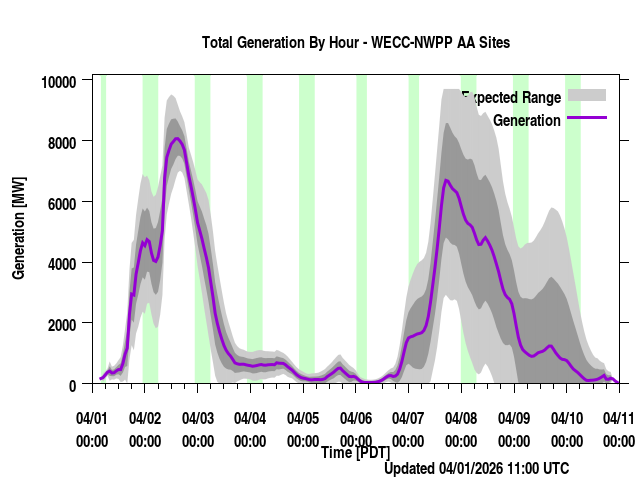
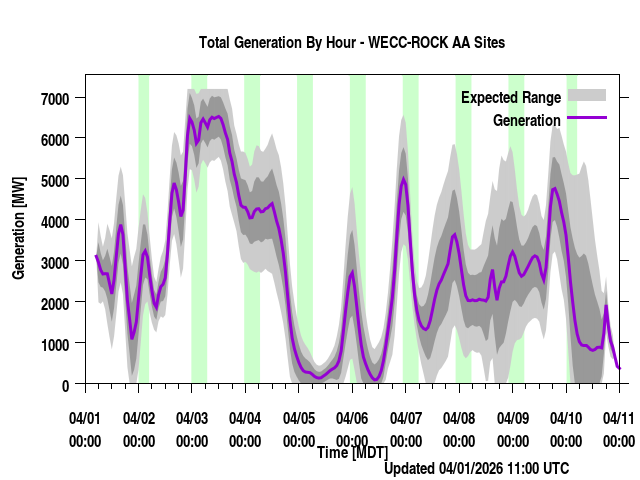
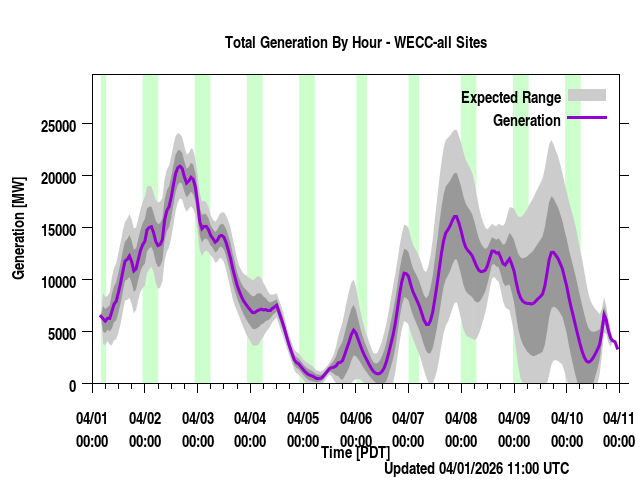
latest_REGION_AA_cumulative_hourly_generation.csv
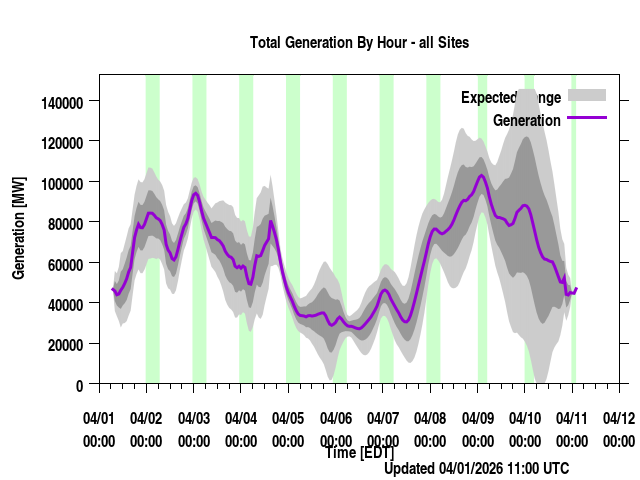
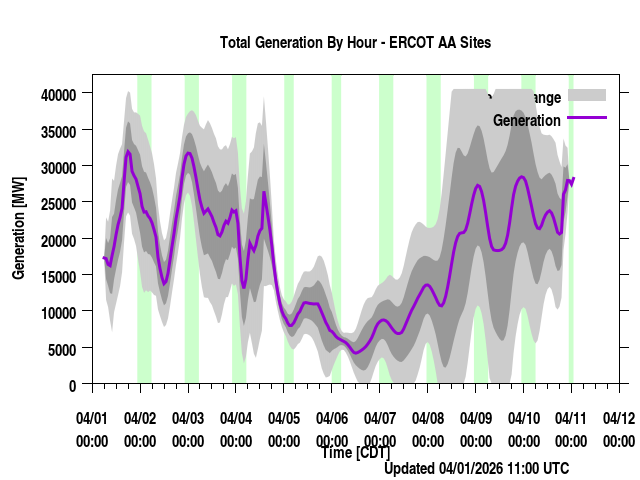
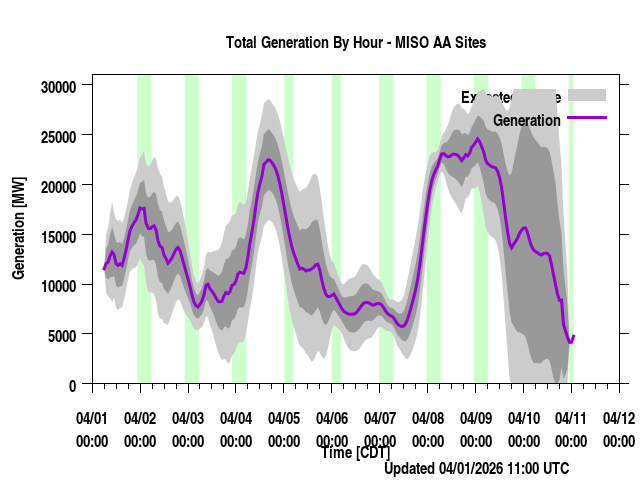
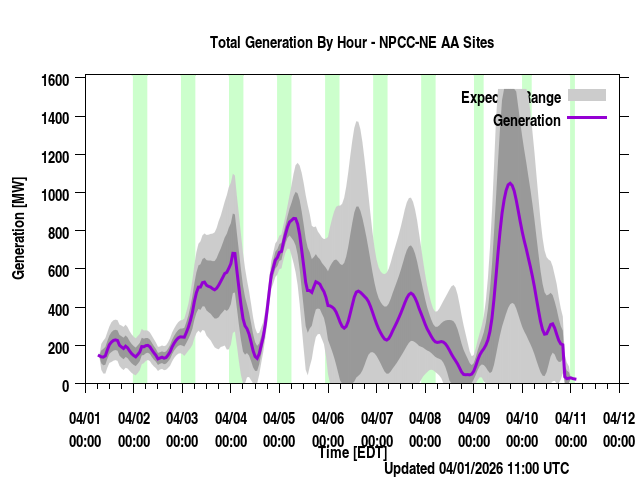
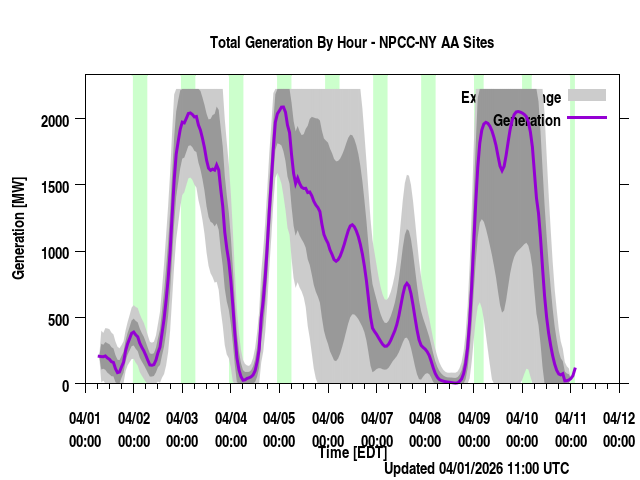
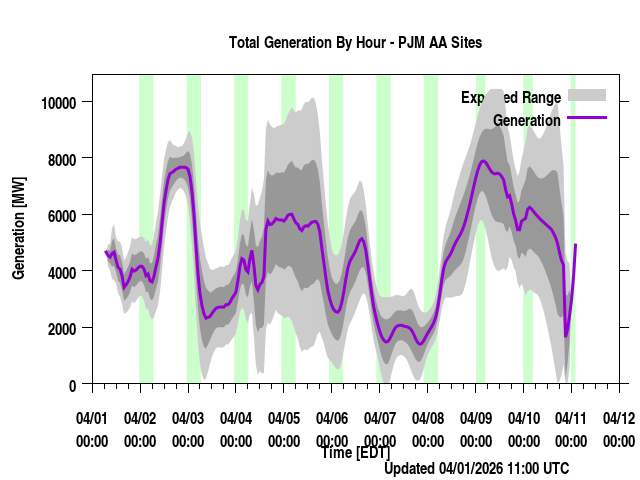
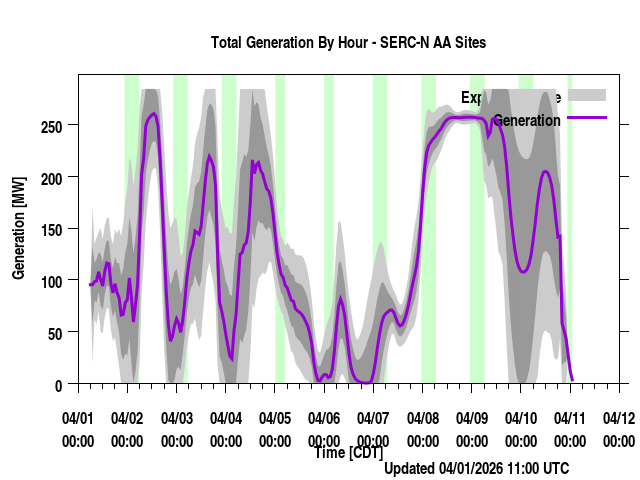
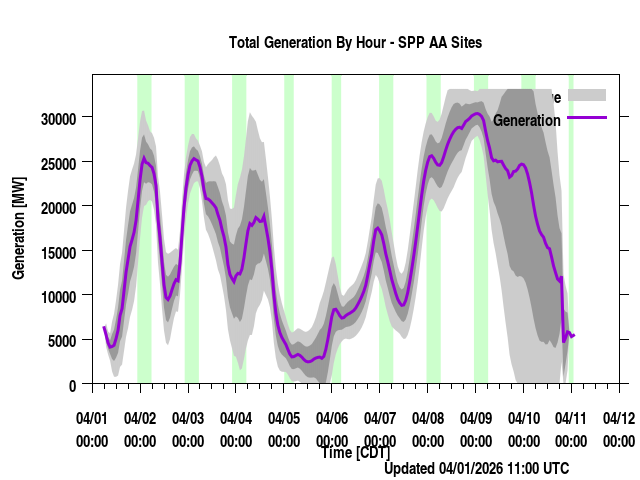
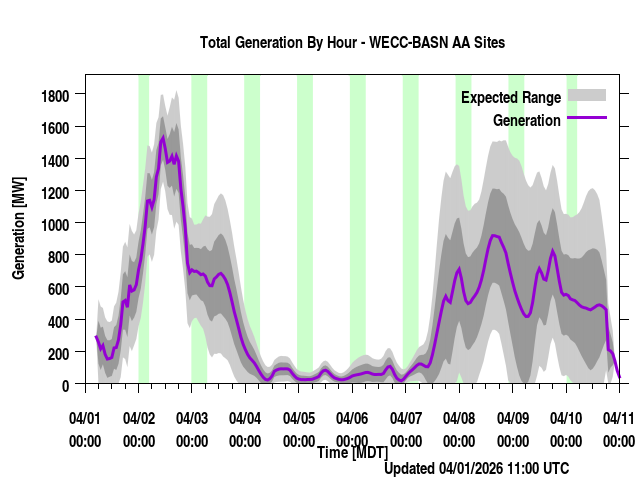
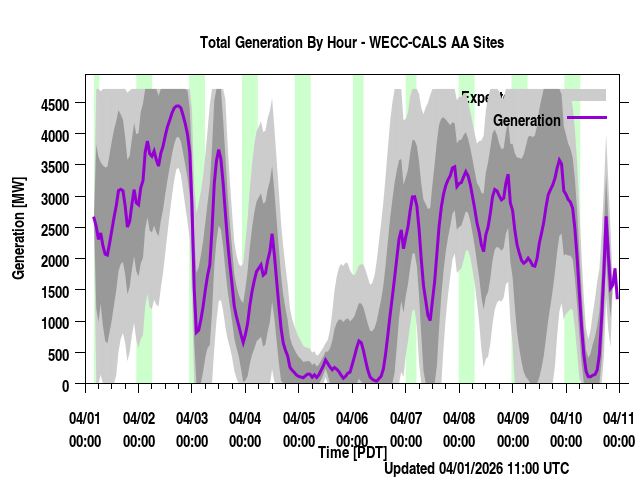
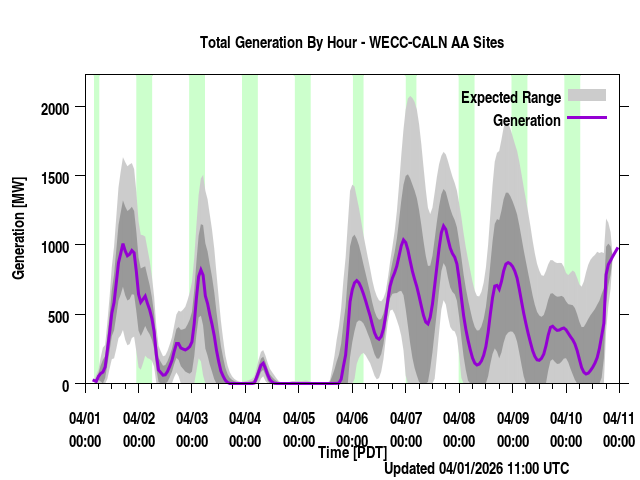
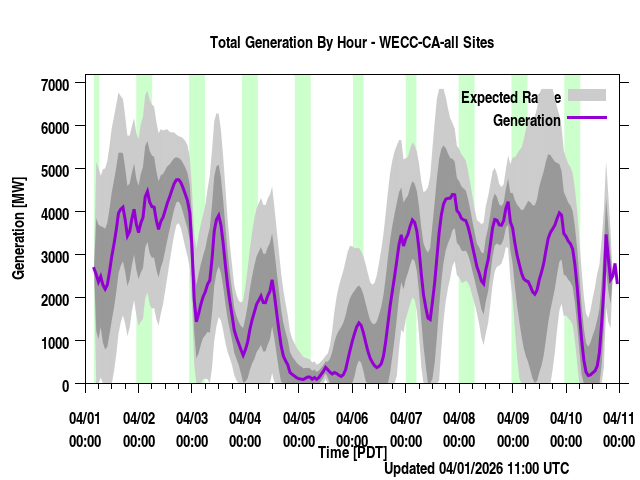
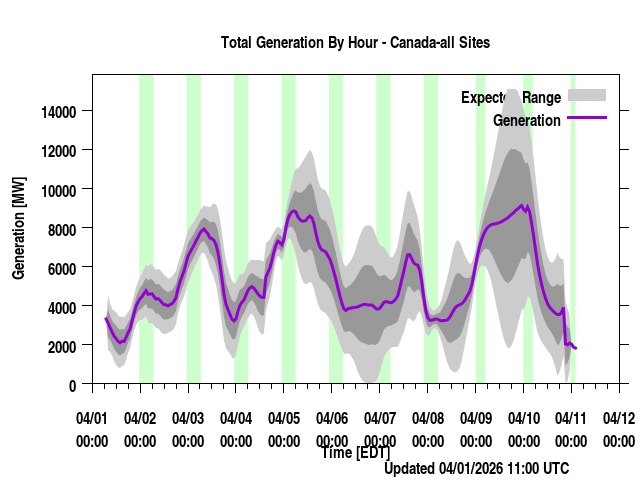
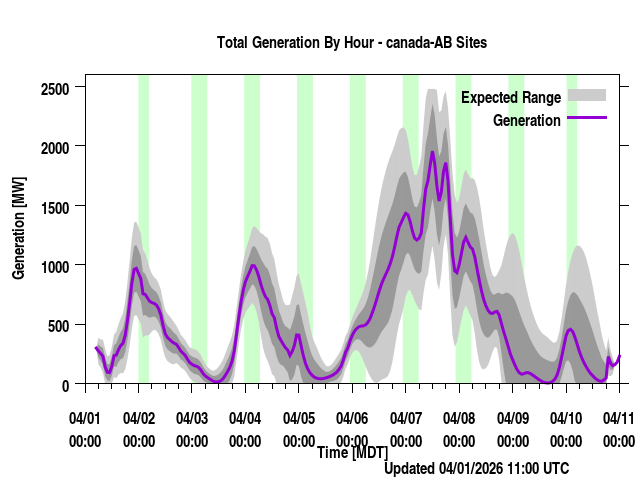
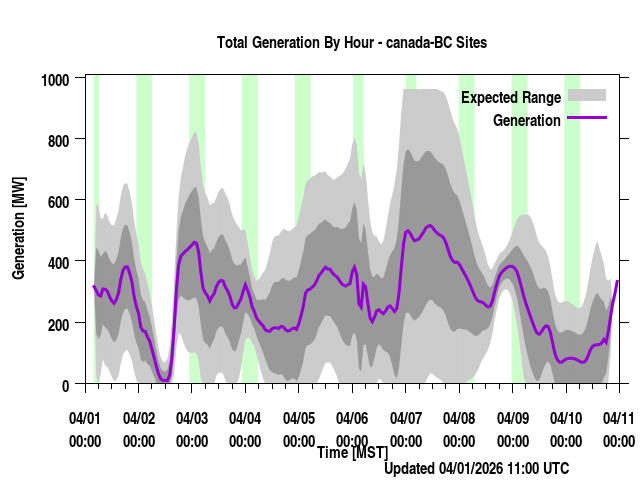
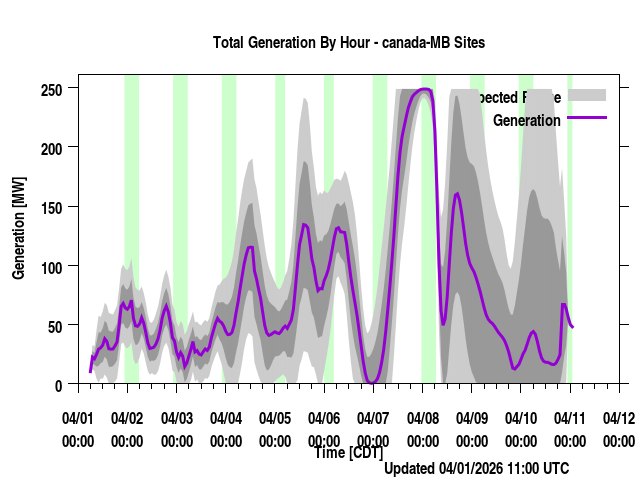
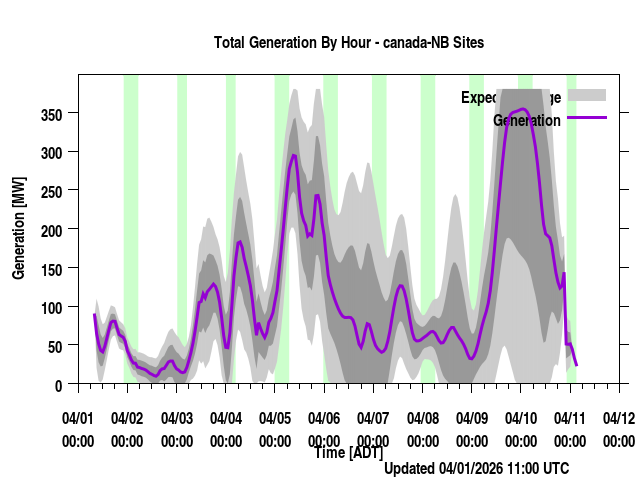
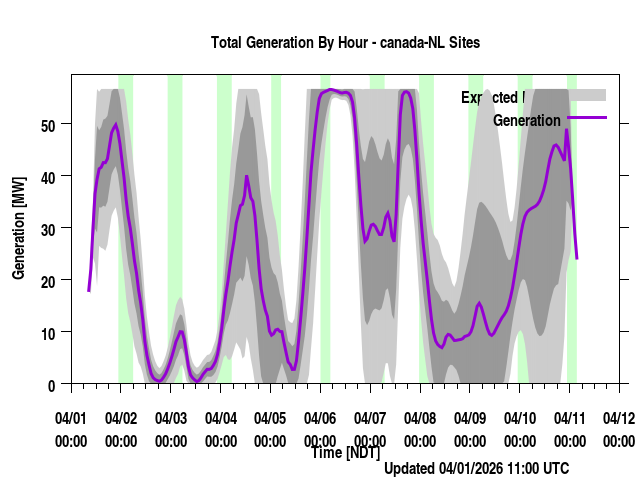
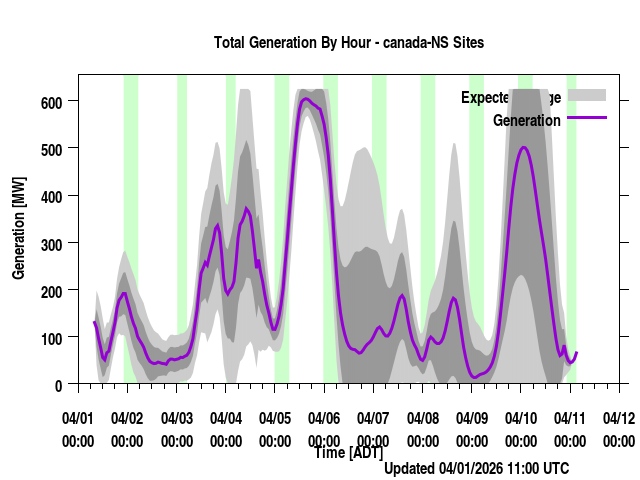
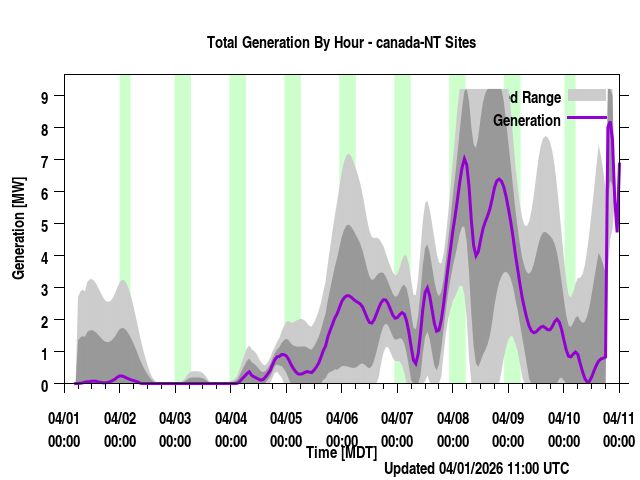
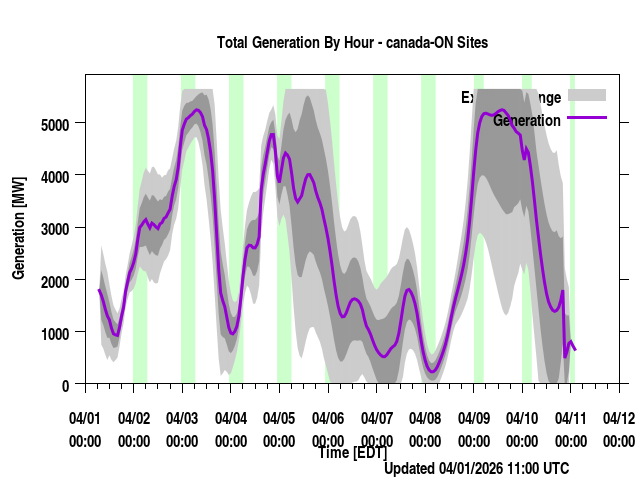
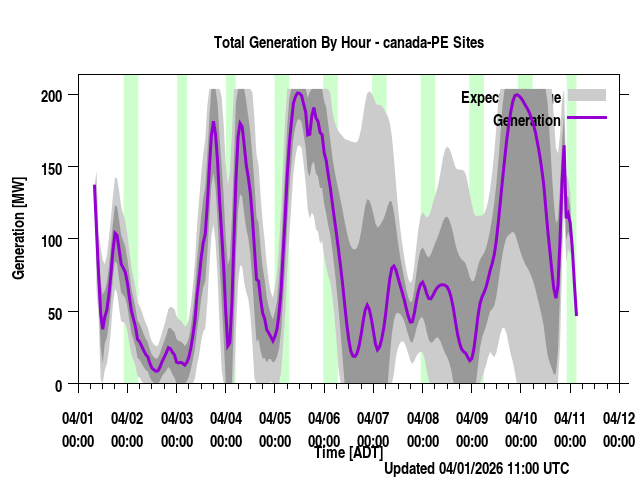
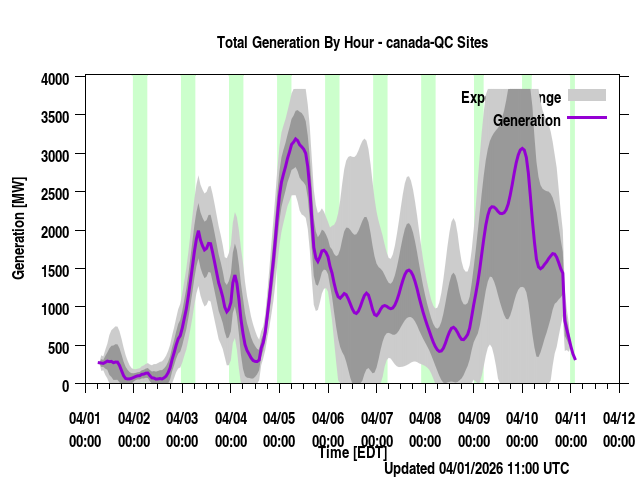
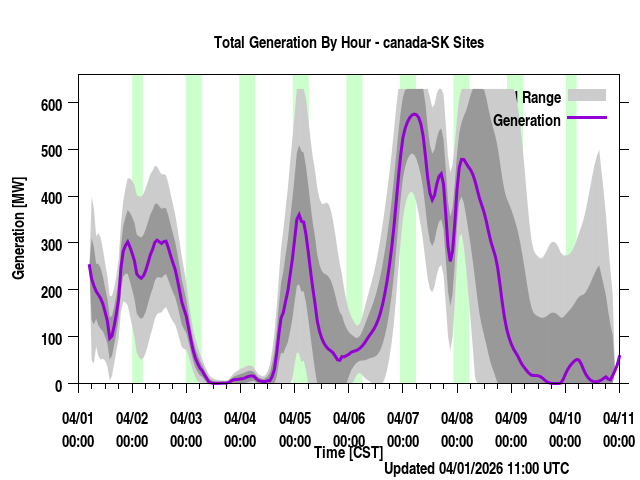
Where REGION is a province or power region, contain the total generation forecast for that region (the sum of the individual farm output for that region). Times are listed in local prevailing time (for regions that span a time zone, the time zone most of the wind farms are in are used) as well as UTC time. The forecast generation is given along with a "generation_upper" and "generation_lower" values. These are plus/minus one standard deviation from the forecast. "generation_BC" is a bias corrected version of the forecast if applicable. Presently, none of the regions have bias corrected values (though we have done this at times in the past) and so those will always be identical to the generation values.
The files of the format:
latest_REGION_AA_cumulative_hourly_generation_models.csv
contain the forecast power generation for that region with valid times in local prevailing time and UTC. These files contain the Frontier Weather forecast as well as 5 individual modes, the NAM and DGEX extension, conus nest of the NAM, GFS, CMC and higher resolution CMC regional model. The standard deviation of the model average is also listed as well as the FW forecast plus/minus 1 and 2 standard deviations. These are range limited so as not to produce negative values or values greater than the regional generation capacity (based on the total number of farms included in the forecast).
The files of the format:
latest_FARM_NAME.csv
Where FARM_NAME is the name of the wind farm in question, contain multiple parameters:
#site_name=name of site
Valid_time=local prevailing time
U=east-west component of wind
V=north-south component of wind
Wspd_scalar=Weighted model average of scalar wind speed (average of forecast wind speeds)
Wspd_hi=forecast wind speed plus a standard deviation
Wspd_lo=forecast wind speed minus a standard deviation
Generation=forecast power generation
Generation_hi=generation forecast plus a standard deviation
Generation_lo=generation forecast minus a standard deviation
Generation_BC=bias corrected generation value (most are the same as the generation value)
Wdir=forecast wind direction in degrees. Always the direction the wind is blowing from.
Intial_time=the time the forecast was started at (what model times were used)
Fcst_hour=the forecast hour (1,2,3,etc)
Site_capacity=generation capacity of site location
Valid_time(UTC)=valid forecast time in UTC
Intial_time(UTC)=the time the forecast was started at in UTC time.
Wspd_vector=the vector average of the model forecast wind speeds
Wspd_stdev=value of one standard deviation of wind speed
Generation_stdev=value of one standard deviation of generation
Wspd-2stdev=forecast wind speed minus 2 standard deviations
Wspd-1stdev=forecast wind speed minus 1 standard deviation
Wspd+1stdev=forecast wind speed plus 1 standard deviation
Wspd+2stdev=forecast wind speed plus 2 standard deviations
generation-2stdev=forecast generation minus 2 standard deviations
generation-1stdev=forecast generation minus 1 standard deviation
generation+1stdev=forecast generation plus 1 standard deviation
generation+2stdev=forecast generation plus 2 standard deviations
NOTE: generation values in terms of +/- 1 or 2 standard deviations are range limited. That is the values will never be negative or greater than the site capacity.
The files of the format:
REGION_windgenerationwithmodels.csv
Where REGION is a province or power region, are files used for plotting the graphs on the website. They contain the forecast wind generation, the forecast from various models (except for some short range high resolution models), along with the model average, and plus and minus one and two standard deviations (of the model average).